Second Brain
I use a rather non-traditional note-taking method called zettelkasten. It's German for "slip box" and, to be accurate, it's more of a system, or a set of principles, than a prescriptive method. In it, each idea or piece of information lives in a separate and independent note which links to other related notes. The name refers to the physical boxes where notes, written on slips of paper, would be organised and stored for later retrieval. If you're starting to get a scary visual of a room full of boxes filled with paper slips then you're getting the right visual.
In my case, I went digital for obvious reasons; the apartment is too small, paper is flammable, moving would be a headache, and the stationery involved would require its own budget.
I hope you're catching on to the sarcasm.
In all seriousness, however, and although a paper-based zettelkasten is totally valid, I knew that, for me, digital made sense. I also knew when I adoped this system that some other challenges were inevitable. Chief among them were:
What clusters are my notes forming? And how are those clusters connected?
The objective of this project was to answer the above questions. To do so, I needed to see my archive. Two steps were involved:
- Determine which notes point to which, and,
- Use the data from (1) to build a network graph representing the archive.
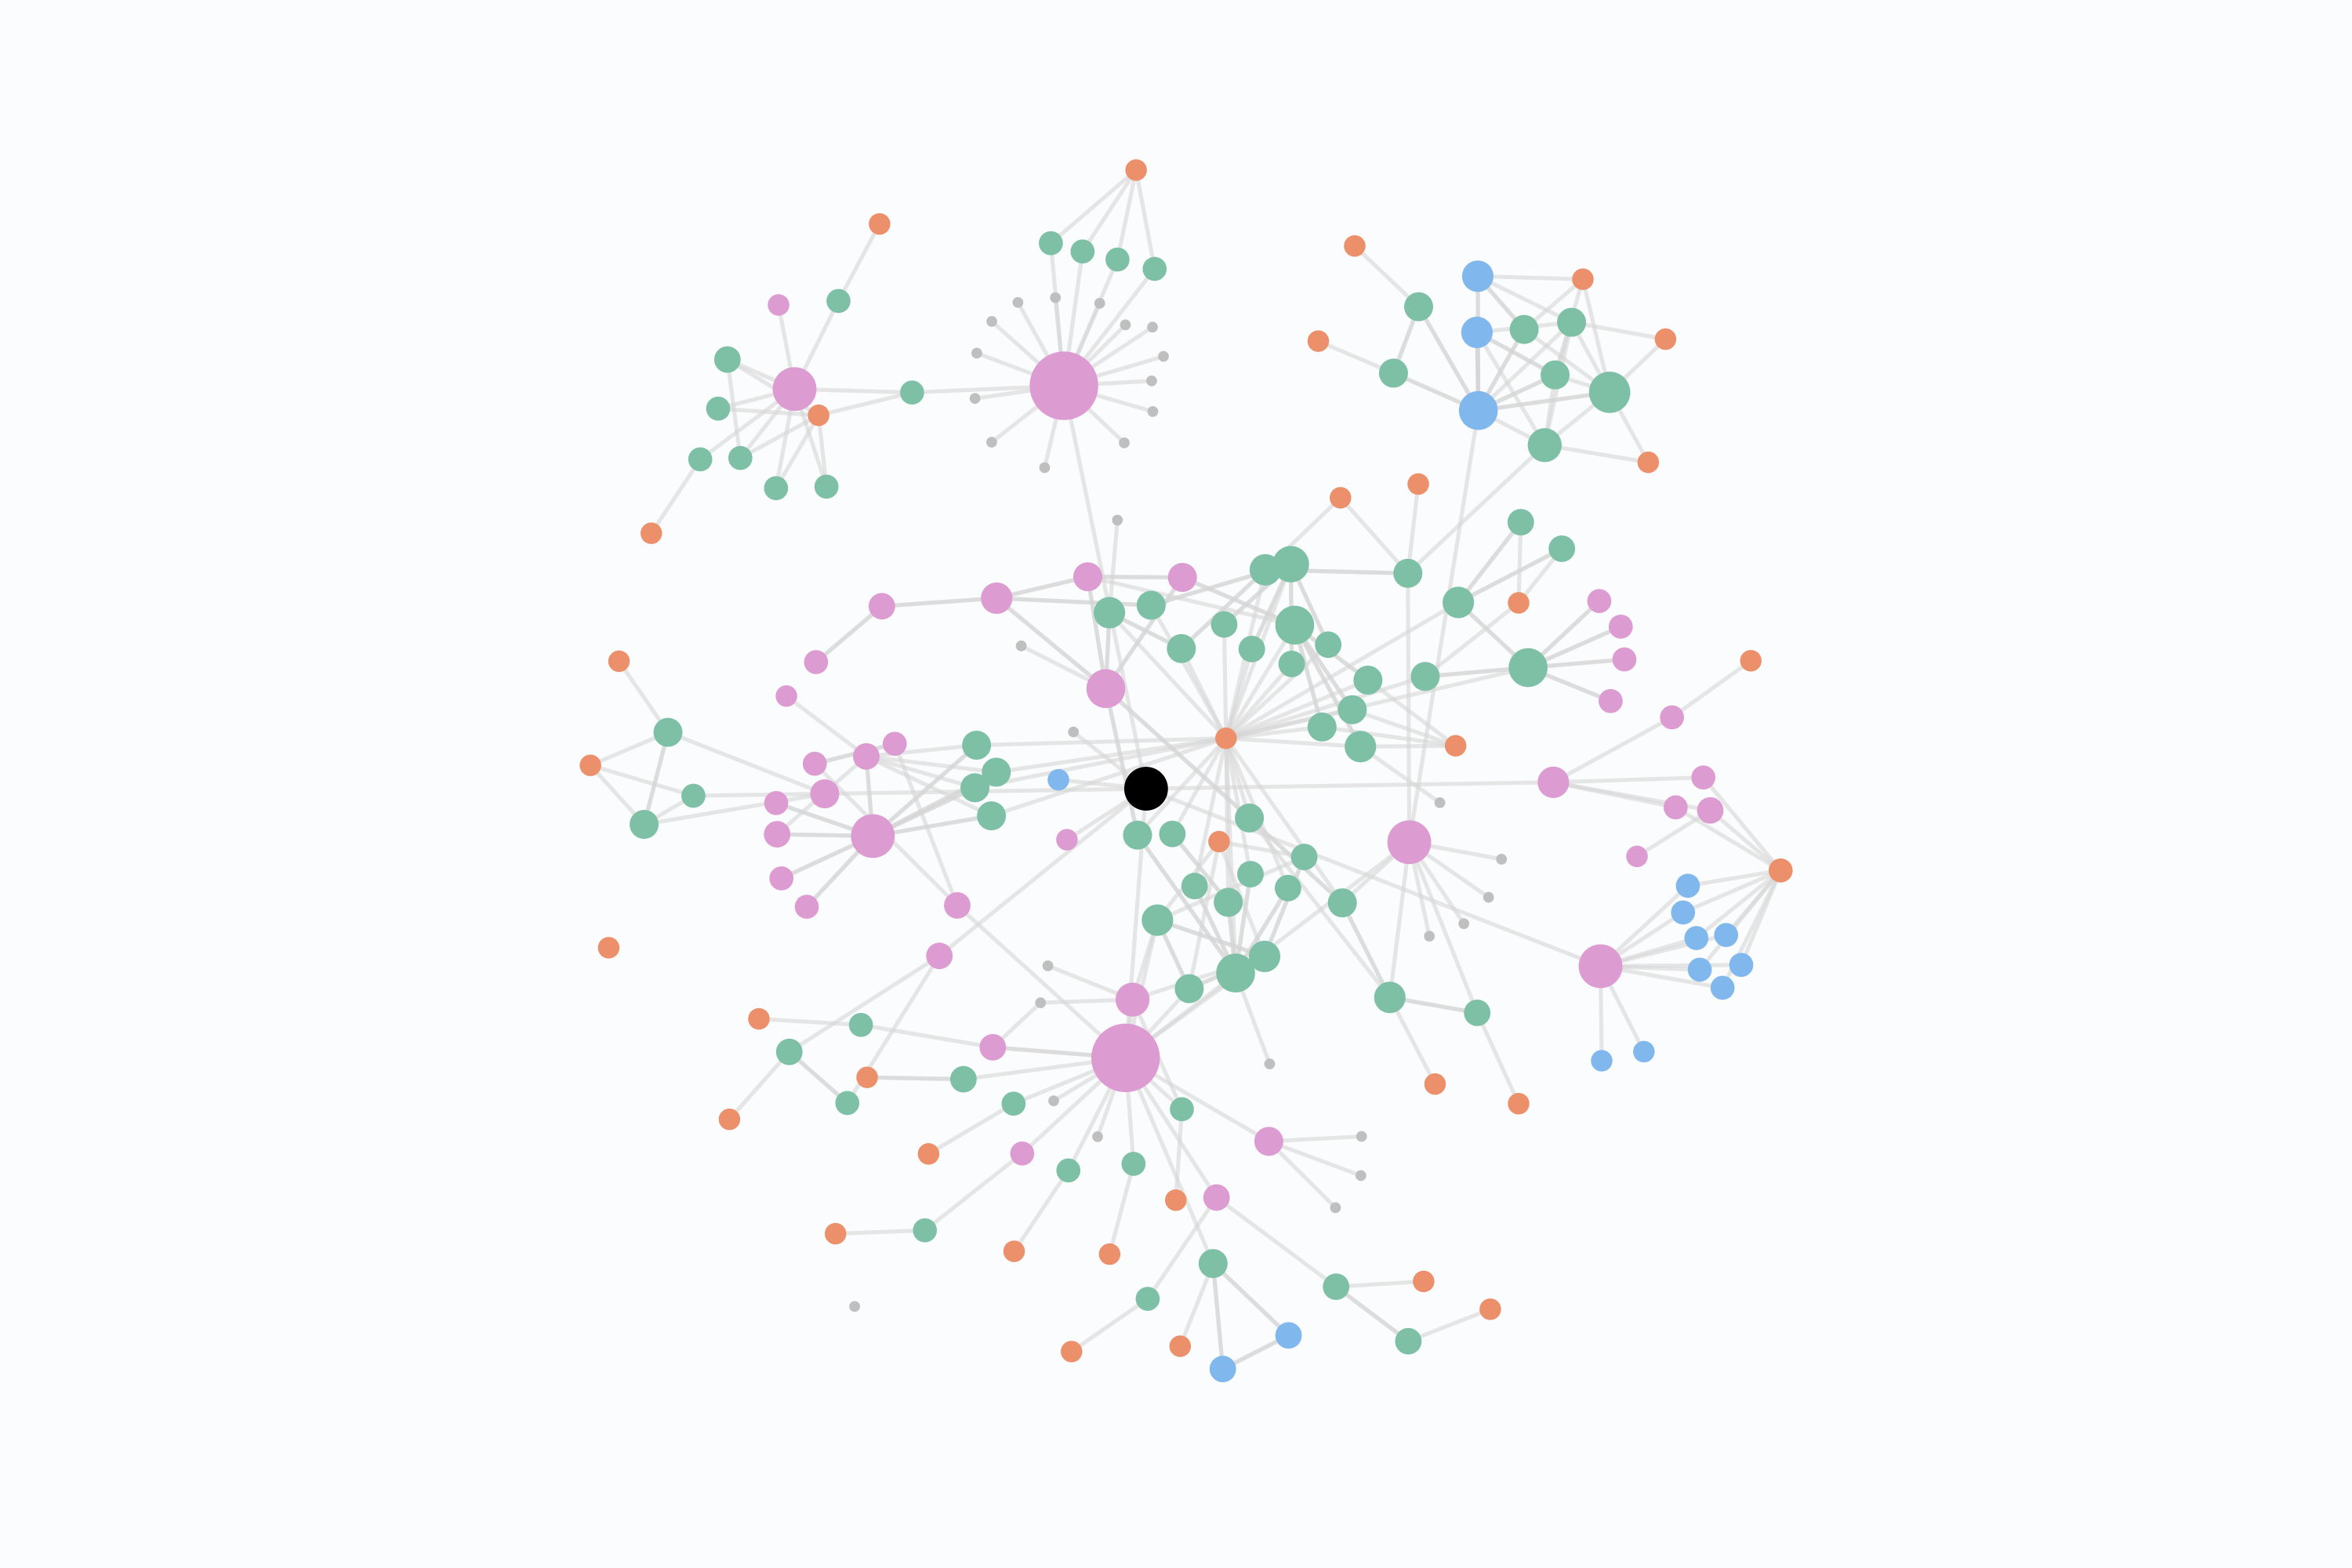
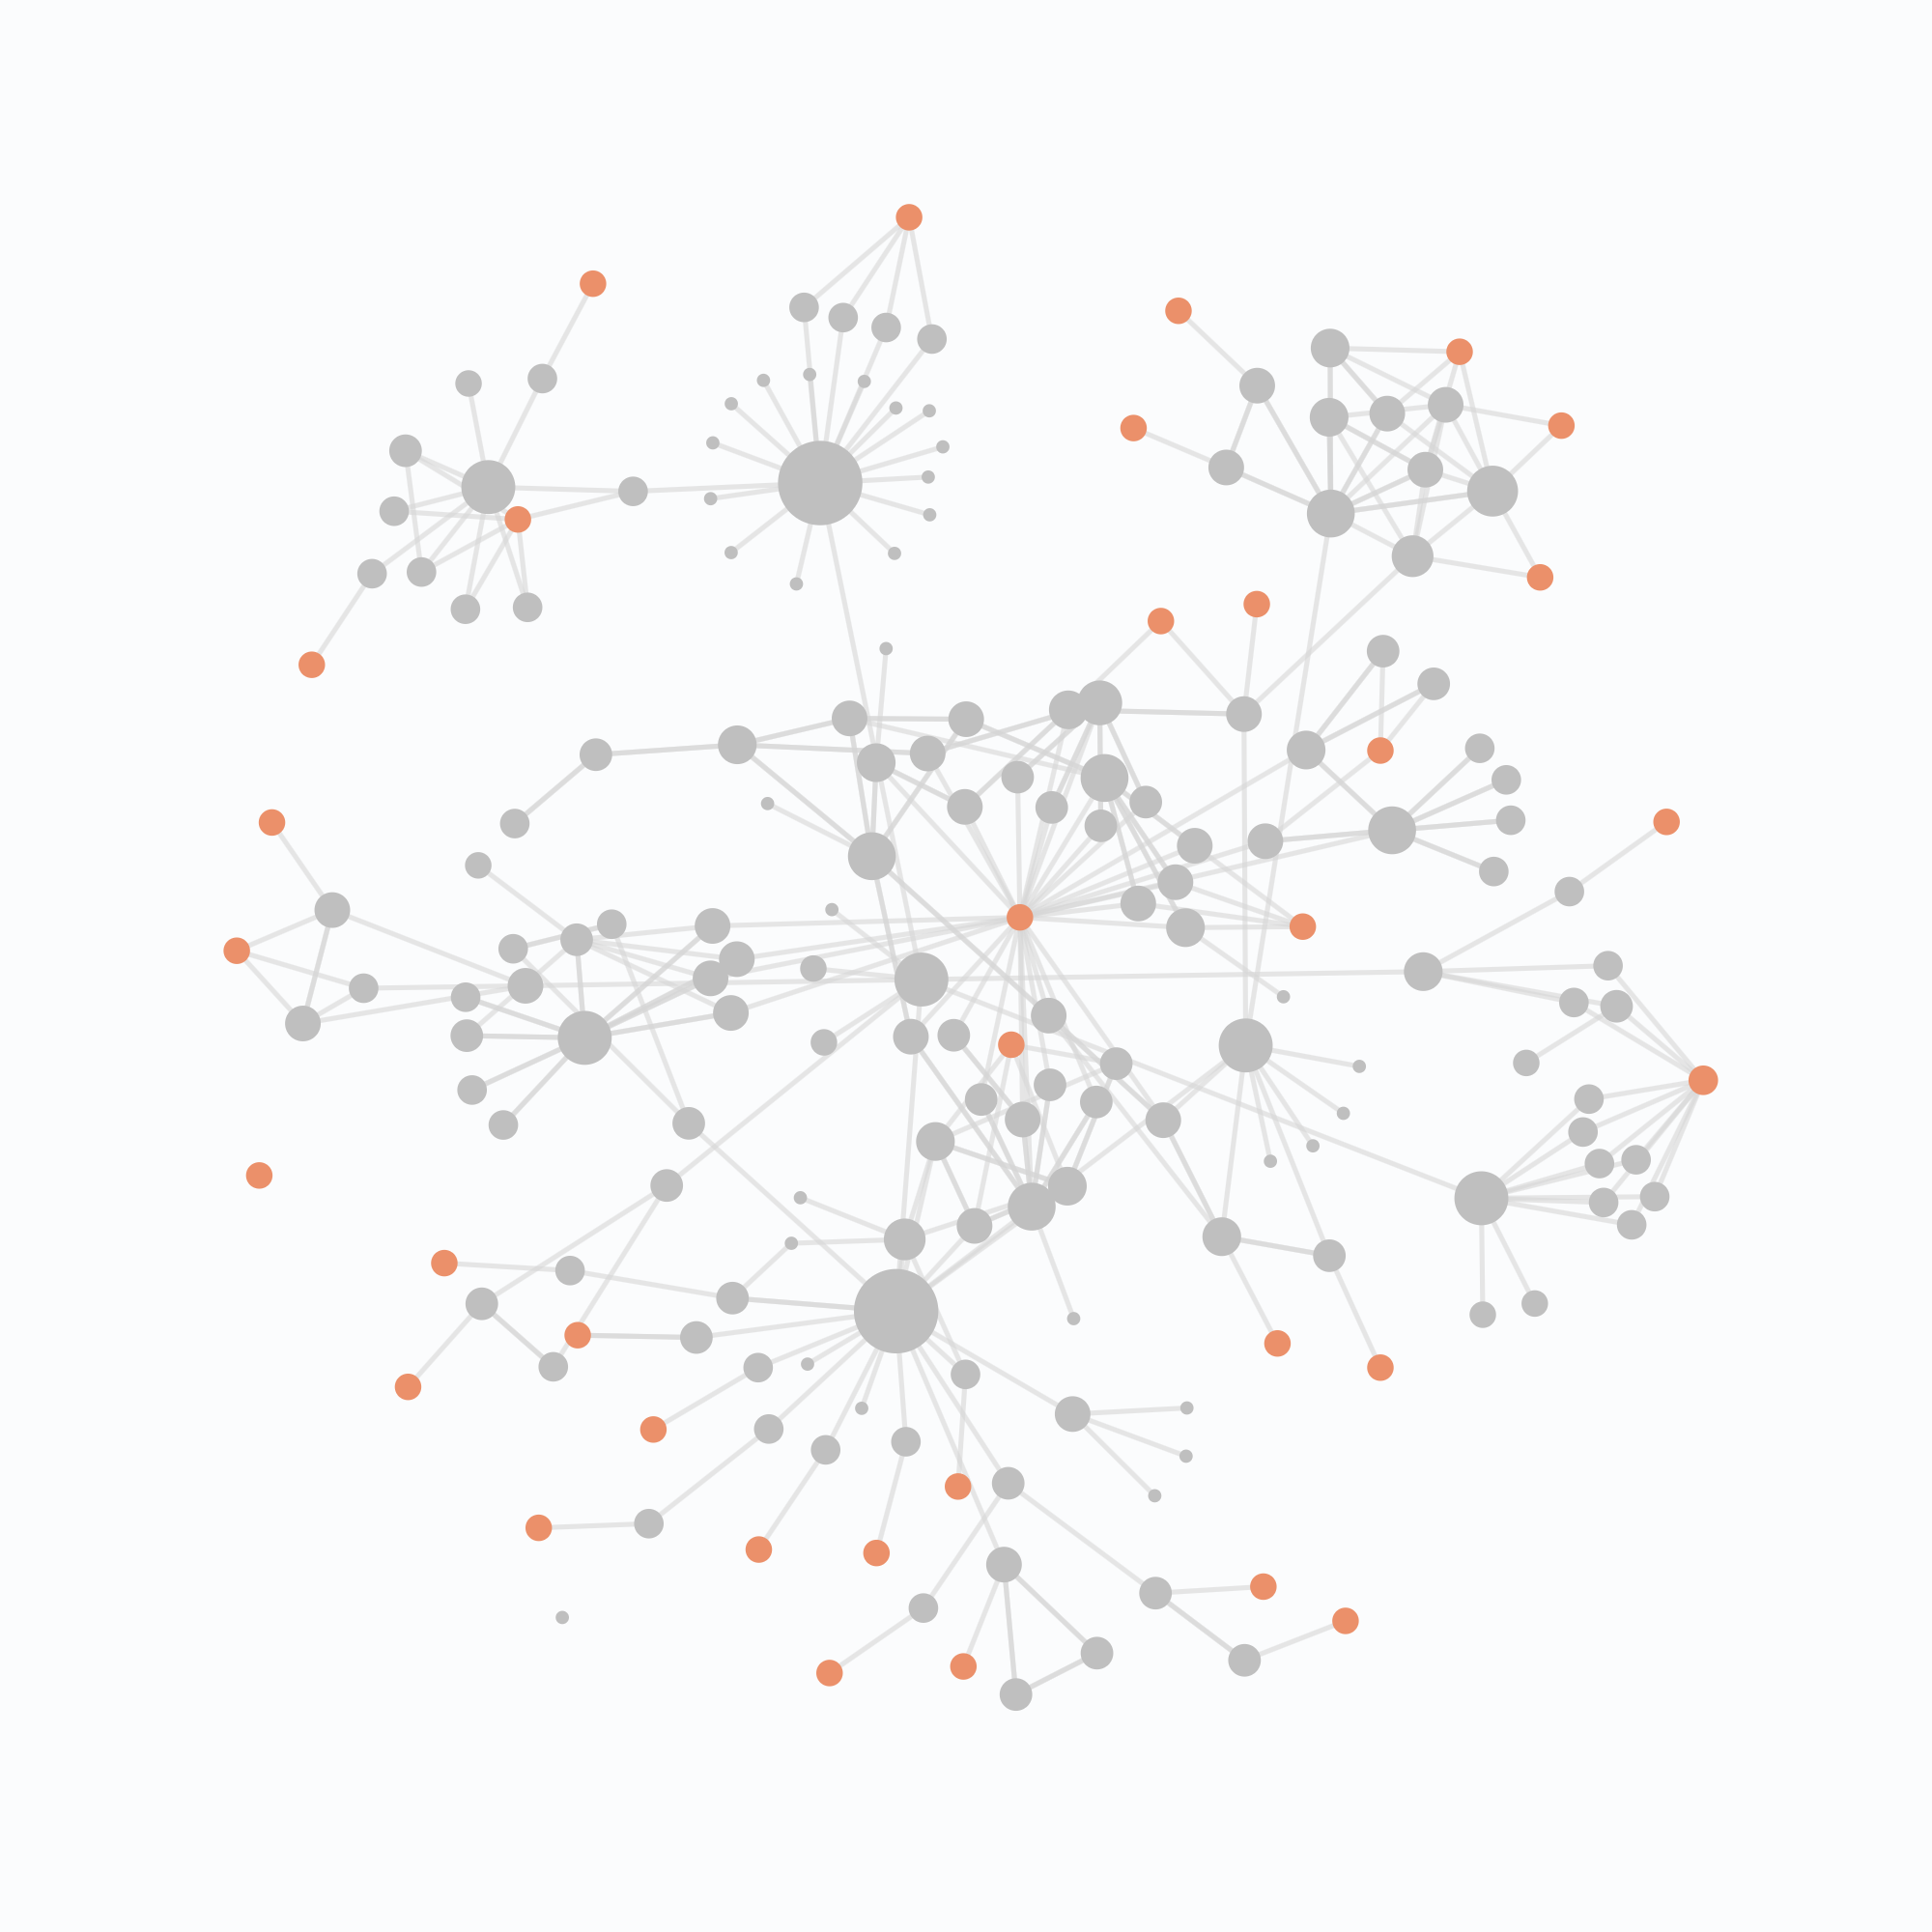
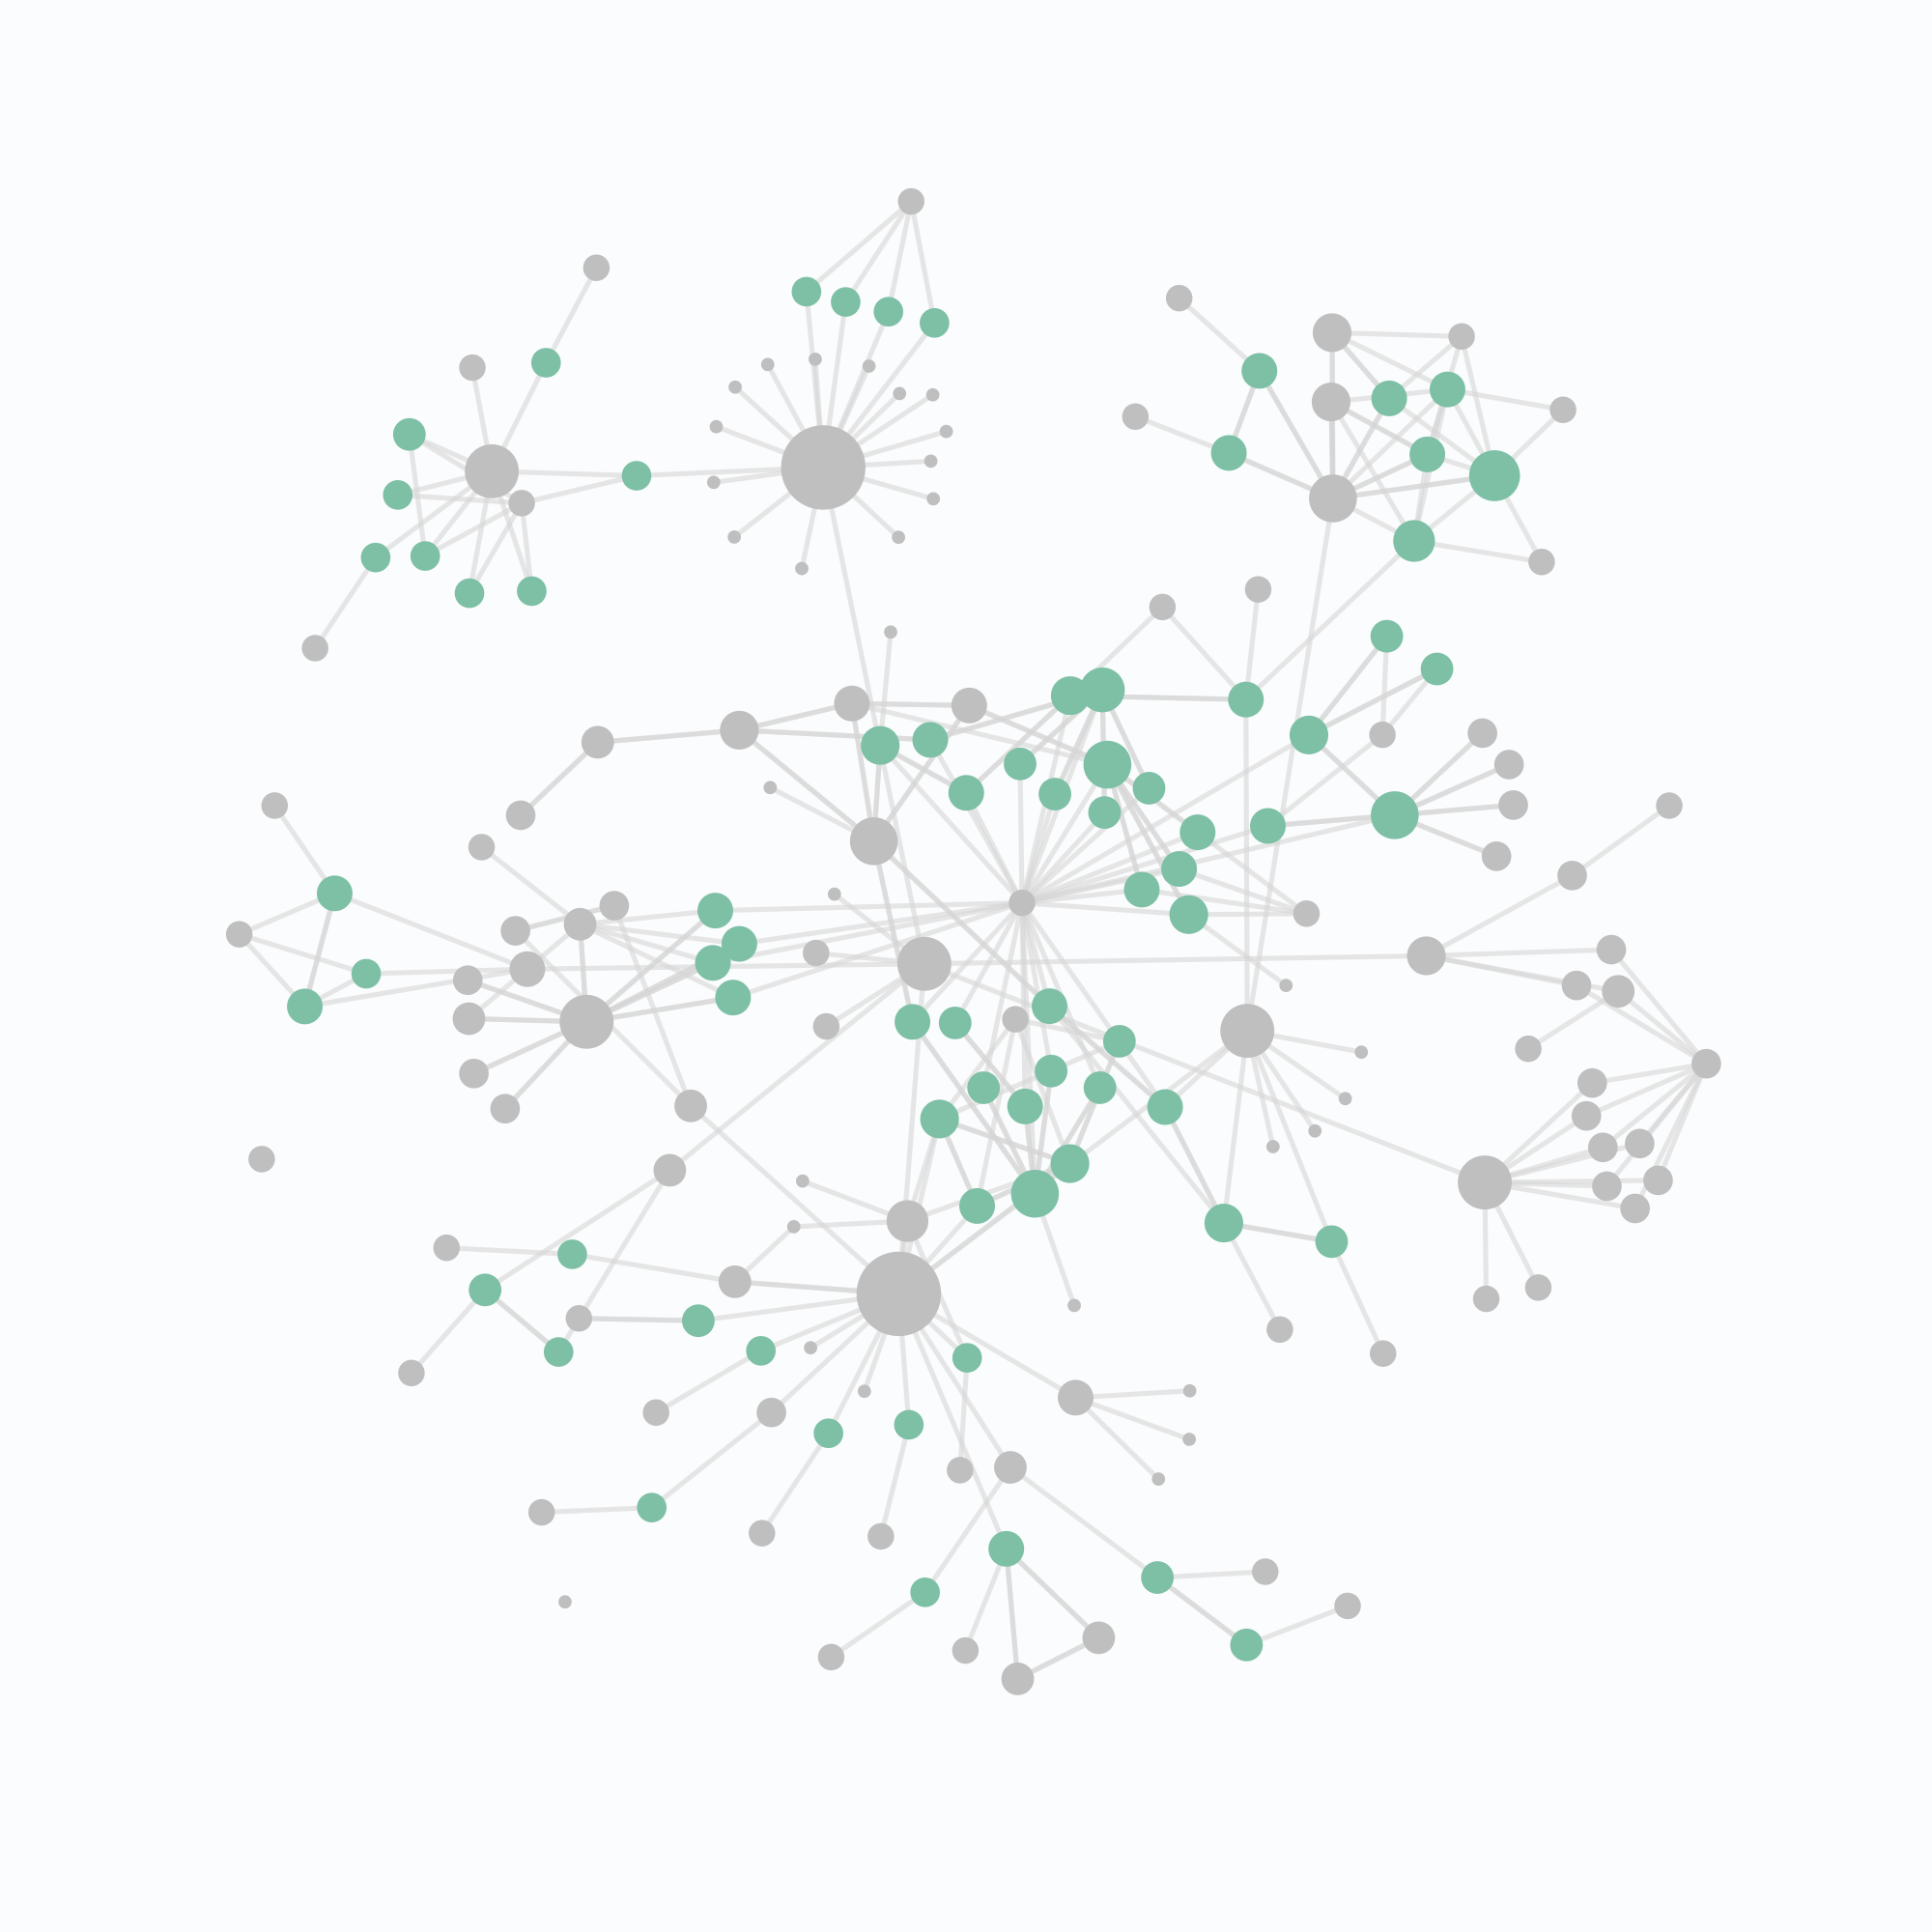
The result of the above two steps is what you see at the top of the page. Each circle (or "node") represents a single note. The size of the node is an indication of the number of notes that point to it. This variation in size communicates a variation in importance of the note; more important notes are pointed to more often. The colour of each node also has a meaning. For example:
- Reference notes, which contain metadata about the information source, e.g. book or video, are orange.
- Literature notes, which are the actual notes I take from those information sources, are green.
This is a living project and will evolve with both my growing archive and my understanding of personal knowledge management. Check back at a later date to see my latest archive!
At a glance
Deliverables
An interactive, force-directed network graph.
Skills
- Front-end development
- Back-end development
Technology
- JavaScript
- Node.js
- D3.js
- CSS